 Skip to content
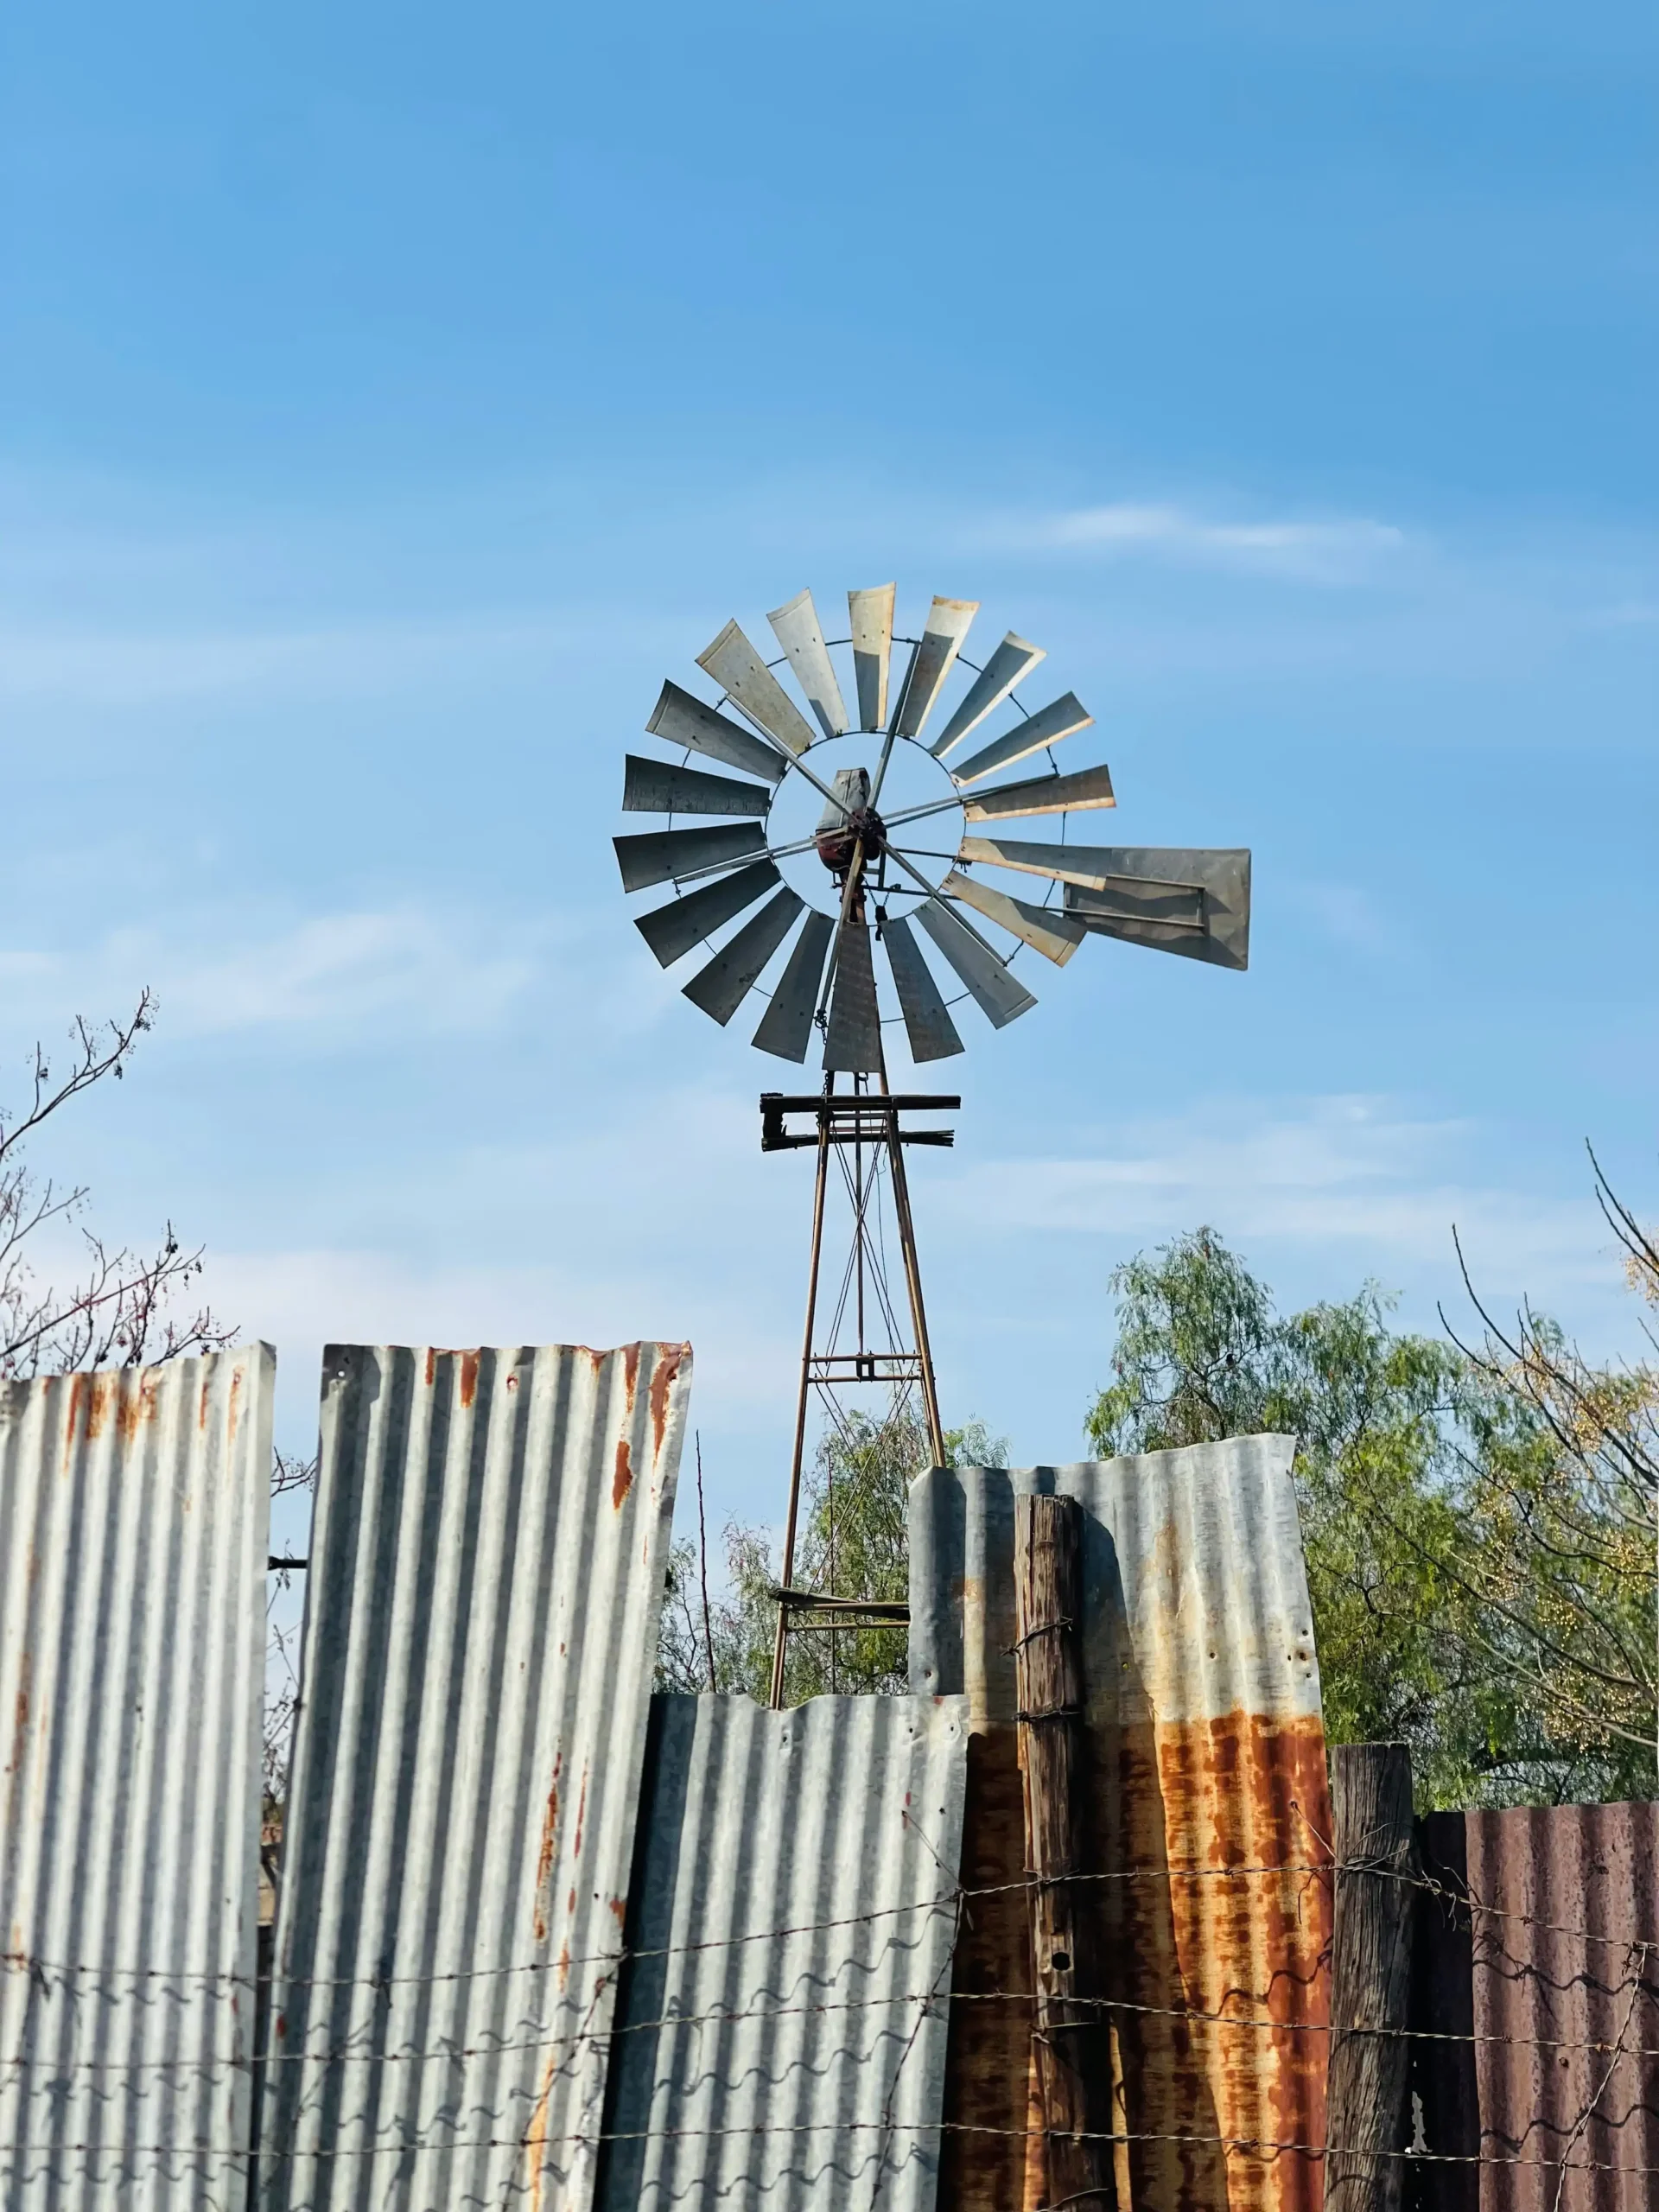
 Running a fence wind load calculation for a temporary site perimeter usually boils down to stopping the concrete bases from sliding across a clay pad after a summer storm. Most project managers default to ordering the heaviest 32-kilo concrete blocks available and calling it a day. That adds serious time to your deployment schedule. You end up paying for extra machine time just to position the barriers, which blows out your labor hours to satisfy a basic safety requirement.
The AS 4687 standard gives you the formula, but it does not tell you that the actual failure point on most temporary panels is the plastic base connector, not the mesh. The mesh holds. If you run the math on a 2.4-metre panel in a 40 metres per second wind event, you will find the uplift force exceeds the sheer weight of standard bases by a narrow margin. Pinning those bases to the ground with 600-millimetre star pickets through the pre-cast holes gives you the anchorage you need. No extra concrete required.

AS/NZS 1170.2 vs ASCE 7-16 Wind Standards
Using an ASCE 7-16 wind load calculator for an Australian fence site under-predicts design wind pressure by 15-25%, creating a direct path to AS 4687-2022 non-conformance.
The Fundamental Equation Divergence
ASCE 7-16 Section 29.3 computes wind pressure using a fixed imperial coefficient of 0.00256, derived from standard air density of 0.0765 lb/ft³. AS/NZS 1170.2 computes the same parameter using 0.5 × ρ, where ρ equals 1.2 kg/m³ at sea level, yielding a metric coefficient of 0.6. The two values are not directly convertible because the underlying gust factor treatment diverges: ASCE 7-16 applies a blanket 0.85 reduction factor for solid freestanding walls, while AS/NZS 1170.2 calculates an aerodynamic shape factor (Cp) specific to the fence’s permeability. For a standard 2.1m temporary fence panel with 50x50mm mesh, this methodological split produces a design pressure that is 15-25% lower under ASCE 7-16 than under AS/NZS 1170.2 at identical nominal wind speeds.
Regional Wind Speed Classification
AS/NZS 1170.2 assigns site-specific ultimate limit state wind speeds by region, not a single national value. These four classifications dictate the baseline wind speed (Vzu) before any terrain or topographic adjustments are applied.
- Region A: 41 m/s — Inland southern Australia, including most of VIC, inland NSW, and SA. Lowest design wind pressures.
- Region B: 45 m/s — Transitional zones, including coastal Tasmania and parts of southern coastal WA.
- Region C: 50 m/s — Most of coastal NSW, metropolitan Melbourne fringe, and non-cyclonic coastal QLD. This is where the majority of Australian civil construction activity occurs.
- Region D: 57 m/s — Cyclonic coastal zones in northern QLD and WA. Design pressures here are roughly double those of Region A.
A fence panel engineered to Region A wind speeds (41 m/s) and installed on a Region C site (50 m/s) will experience approximately 49% more wind force than it was designed to resist. This is not a marginal error — it is a structural failure waiting for the next storm front.
Terrain Category Multipliers and Topographic Factors
AS/NZS 1170.2 applies a terrain/height multiplier (Mz,cat) that adjusts the base wind speed based on ground roughness upwind of the site. This is where the standards diverge most dangerously from ASCE 7-16, which uses Exposure Categories B, C, and D with different roughness length definitions.
- TC1: Mz,cat ≈ 0.91 at 2.1m height — Open water or very flat terrain with negligible roughness. Rarely applies to construction sites.
- TC2: Mz,cat ≈ 0.95 at 2.1m height — Open grassland, cleared land. Applies to greenfield development sites.
- TC2.5: Mz,cat ≈ 1.01 at 2.1m height — The default assumption for most suburban construction sites with scattered obstructions.
- TC3: Mz,cat ≈ 1.06 at 2.1m height — Urban areas with closely spaced obstructions. Reduces effective wind speed at fence height due to sheltering.
The topographic multiplier (Mt) is the second adjustment, applied when a site sits on a hill, ridge, or escarpment. Mt ranges from 1.0 (flat ground) to approximately 1.3 for steep slopes exceeding 1:5 gradient near the crest. A Region C site (50 m/s) on TC2.5 terrain at Mt=1.15 produces a design wind speed of 58.3 m/s — exceeding the Region D baseline. ASCE 7-16 handles topography through a separate Kzt factor, but the upstream terrain length definitions differ, producing inconsistent results when applied to Australian topography.
Non-Compliance Risk: What Actually Happens on Site
Every major free online fence wind load calculator — Meca Enterprises, Wheatland, CLFMI — uses ASCE 7-16 methodology. An Australian project manager who runs a wind check through these tools receives a design pressure in psf (pounds per square foot) based on US terrain categories and US gust factors. When that calculated pressure is converted back to kPa and used to specify footing mass or post spacing for an AS 4687-2022 compliant temporary fence installation, the specification is fundamentally under-designed by 15-25%.
The practical failure mode is predictable: a standard 34kg concrete-filled temporary fence foot provides approximately 0.33 kN·m of overturning resistance. At Region C wind speeds on a 2.1m panel with correct AS/NZS 1170.2 calculations, that resistance is marginal even at TC2.5 terrain. If the site sits on exposed TC2 ground with Mt exceeding 1.05, the panel will blow over in moderate gust conditions. When a workplace safety inspector references AS 4687-2022 and finds that the installed fence was specified using an ASCE 7-16 calculator, the non-conformance notice is not a negotiation — it is a procedural certainty. For a project manager, that means procurement cost per lineal metre becomes irrelevant compared to liquidated damages accruing while replacement fencing is sourced, manufactured, and shipped from China.
The correct workflow for AS 4687 temporary fence wind load requirements is unambiguous: determine your AS/NZS 1170.2 region and wind speed, classify your terrain category, assess topographic multiplier, calculate mesh solidity ratio from the actual panel specification (not a generic assumption), and compute design pressure using the AS/NZS 1170.2 formula. Any supplier unable to provide engineering documentation derived from this chain is providing a wind rating claim, not a compliance calculation.
Solidity Ratio: Mesh Specs Drive Wind Loads
Changing mesh specification from 50x50mm/3.5mm to 75x75mm/4.0mm wire drops the solidity ratio from ~22% to ~15%, cutting effective wind force by 30%—yet most suppliers quote one generic wind rating for all panels.
Defining Solidity Ratio for Welded Mesh
Solidity ratio (e) equals the projected solid area of all wire elements divided by the total gross panel area. For welded mesh, this means summing the projected width of every horizontal and vertical wire, including weld nuggets, across the panel face, then dividing by height multiplied by width. The formula is e = solid area / gross area. The challenge is not the math—it is getting an honest number from your supplier. Most wholesale temporary fence panels are sold with a single wind rating on the data sheet, implying one solidity ratio applies across all configurations. It does not.
Configuration Comparison: 50x50mm vs 75x75mm Mesh
We calculated the actual solidity ratios for the two most common temporary fence mesh specs ordered into Australia. A panel with 50x50mm aperture and 3.5mm wire diameter produces a solidity ratio of approximately 22%. Switching to a 75x75mm aperture with 4.0mm wire on the same frame dimensions drops the ratio to approximately 15%. The larger aperture removes more open area than the thicker wire adds back in solid area. When you are procuring wholesale temporary fence panels for a Region C or Region D site under AS/NZS 1170.2, a 7-percentage-point shift in solidity ratio directly changes your footing specification and post spacing requirements.
Applying the Reduction Factor to Effective Wind Force
AS/NZS 1170.2 does not apply full wind pressure to a permeable fence. The effective wind force is calculated using the reduction factor: Cf = 1 – (1-e)^1.5. For the 50x50mm/3.5mm configuration at e = 0.22, the reduction factor is 0.31, meaning the panel receives 31% of the solid-wall wind pressure. For the 75x75mm/4.0mm configuration at e = 0.15, the factor drops to 0.22. That 30% reduction in effective wind force translates to a proportional reduction in required overturning resistance at the base. On a 2.1m panel in Region C conditions, this can be the difference between a standard 34kg concrete-filled foot being marginally compliant and being comfortably within spec—or requiring double ballast. If your supplier cannot provide the calculated Cf coefficient for your specific mesh configuration, their wind rating is an assumption, not an engineering calculation.
Wire Diameter Tolerances and Fatigue Risk Under Wind Loading
Here is a detail that almost never appears on a fence spec sheet: wire diameter tolerance. Welded mesh wire is produced to a tolerance range, typically ±0.05mm for drawn wire. A supplier delivering 3.5mm wire at the bottom of tolerance (3.45mm) reduces your solid area by roughly 2.8% per wire. Alone, this is a minor geometry shift. Combined with a thin galvanized coating—anything under 42 microns—it becomes a fatigue risk. Wind loading on temporary fencing is cyclic: gusts load the panel, then release, hundreds of times per hour during a storm event. Each cycle stresses the weld joints and any surface defect in the coating. A thinner wire has less cross-sectional material to tolerate micro-cracking at the weld toe. Once the galvanized layer is breached at a weld point, corrosion accelerates rapidly under repeated flexing. This is precisely why DB Fencing specifies hot-dipped galvanized finishes exceeding 42 microns on all panels—the coating thickness provides a corrosion buffer that absorbs surface stress from wind fatigue before the base metal is exposed. If a supplier quotes 50% below market on wholesale temporary fence panels, verify the wire diameter with caliper photos and demand the galvanization thickness certificate. The savings will not survive a Region D storm event.

Step-by-Step Fence Wind Load Calculation
Using ASCE 7-16 wind load calculators for Australian sites under-predicts design pressures by 15–25% compared to AS/NZS 1170.2 — the primary cause of “compliant” fencing failing site inspection.
Step 1 — Determine Regional Wind Speed (V) from AS/NZS 1170.2
Open AS/NZS 1170.2 Table 3.1 and identify your site’s wind region by referencing the map in Figure 3.1. Australia is divided into four regions with the following ultimate limit state (ULS) regional wind speeds: Region A = 41 m/s, Region B = 45 m/s, Region C = 50 m/s, Region D = 57 m/s. Melbourne metropolitan areas fall under Region C. Do not interpolate between regions — each boundary is a hard line on the map, and your site sits definitively in one zone.
A critical distinction from the American standard: ASCE 7-16 uses a 3-second gust speed measured at 10m height in open terrain (Exposure C), while AS/NZS 1170.2 Regional Wind Speeds are already calibrated for the worst-case direction with inherent gust factors embedded in the multiplier system. You cannot convert between them with a simple unit swap.
Step 2 — Calculate Site Wind Speed (Vsit)
Apply the site-specific multipliers using the formula Vsit = V × Md × (Mz,cat × Ms × Mt). Each multiplier adjusts the regional speed for local conditions. Md is the direction multiplier from Table 3.2 — for temporary fencing which can face any wind direction, use the worst-case value of Md = 1.0. Mz,cat is the terrain/height multiplier from Table 4.1 — this is where the AS/NZS and ASCE standards diverge significantly. Australian terrain categories (TC1 through TC4) do not map directly to ASCE exposure categories, and using the wrong TC can shift your result by 20% or more.
For a typical construction site in suburban Melbourne classified as TC2 (open terrain with scattered obstructions), at a fence height of 2.1m, Mz,cat = 0.91 from Table 4.1. Set shielding multiplier Ms = 1.0 (assume no upwind shielding for conservative design) and topographic multiplier Mt = 1.0 for flat ground. Vsit = 50 × 1.0 × (0.91 × 1.0 × 1.0) = 45.5 m/s.
Step 3 — Compute Design Wind Pressure (q)
Convert site wind speed into dynamic pressure using q = 0.5 × ρ × Vsit², where ρ is air density. At sea level, AS/NZS 1170.2 specifies ρ = 1.2 kg/m³. For the Melbourne example: q = 0.5 × 1.2 × 45.5² = 0.6 × 2070.25 = 1,242 Pa, or 1.24 kPa. This represents the peak dynamic pressure acting on a perfectly solid surface at your fence height — but your fence is not solid, which is where most suppliers either save you money or expose their lack of engineering rigour.
Step 4 — Apply Solidity Reduction and Aerodynamic Shape Factor (Cf)
This is where most temporary fence suppliers cut corners. A welded mesh panel is not a solid wall, and treating it as one over-estimates the wind load by 55–65%. Calculate your panel’s solidity ratio (e) by dividing the total solid area of wire and frame by the gross panel area. For a standard 2.1m × 2.4m temporary fence panel with 50×50mm mesh and 4mm wire, the solidity ratio is approximately 0.22 (22%). Changing to a 75×75mm mesh with 4.0mm wire drops this to roughly 0.15 — a 30% reduction in effective wind force, which directly translates to less concrete in your footings.
Apply the solidity reduction factor using the formula: Reduction Factor = 1 – (1 – e)^1.5. For e = 0.22: Reduction Factor = 1 – (0.78)^1.5 = 1 – 0.689 = 0.311. Then read the aerodynamic shape factor Cf from AS/NZS 1170.2 Figure 5.3 for free-standing walls. For a panel with height-to-length ratio h/L = 2.1/2.4 = 0.88 and solidity ratio e = 0.22, Cf ≈ 1.4. Your effective design wind pressure becomes: peff = q × Reduction Factor × Cf = 1.24 × 0.311 × 1.4 = 0.54 kPa. Total force per panel = 0.54 × (2.1 × 2.4) = 2.72 kN.
Worked Example — 2.1m Panel, Melbourne Region C, TC2 Terrain
Pulling the four steps together for a 50×50mm mesh panel with 4mm wire, including the 40×40×2.5mm galvanised frame (hot-dipped, >42 microns per our manufacturing standard): Regional Wind Speed V = 50 m/s (Region C). Site Wind Speed Vsit = 50 × 1.0 × (0.91 × 1.0 × 1.0) = 45.5 m/s. Dynamic Pressure q = 0.5 × 1.2 × 45.5² = 1.24 kPa. Solidity Ratio e = 0.22, giving Reduction Factor = 0.311. Cf = 1.4 from Figure 5.3 (h/L = 0.88). Effective design wind pressure = 0.54 kPa. Total wind force per 2.1m × 2.4m panel = 2.72 kN, acting at approximately 1.05m above ground (centroid of the panel face).
The resulting overturning moment at the base of a single post = 2.72 × 1.05 = 2.86 kN·m. A standard 34kg concrete-filled temporary fence foot provides approximately 0.33 kN·m of overturning resistance — a deficit of 2.53 kN·m. This is not a failure of the panel; it is a clear engineering signal that your post spacing must be reduced from the standard 2.4m, or additional ballast blocks must be specified. When you source wholesale temporary fence panels directly from a manufacturer that provides this calculated data per panel specification, your procurement tender includes defensible engineering justification rather than a generic “wind rated” claim that a site inspector can reject on the spot.
Why This Calculation Belongs in Your Procurement Tender
Most temporary fencing suppliers quote a single wind speed rating (e.g., “rated to 130 km/h”) without specifying the terrain category, solidity ratio, or which standard they calculated against. This is the structural equivalent of stating a vehicle’s top speed without mentioning whether the road is uphill or downhill. When a WHS inspector or private certifier challenges your fence installation under AS 4687-2022, a generic wind rating provides zero legal protection. The five-step calculation above, tied to a specific panel mesh specification and site classification, is the minimum documentation your tender should require from any supplier — and it is exactly what we provide with every panel specification we quote.

Footing Overturning: The Hidden Cost Variable
A 34kg concrete-filled plastic foot delivers 0.33 kN·m overturning resistance—sufficient for Region A/B, but at 47 m/s on a 2.1m panel, this becomes a margin-of-safety calculation, not a given.
CLFMI Footing Embedment Formula: The Australian Adaptation Problem
The CLFMI Chain Link Fence Manufacturers Institute wind load guide provides a footing embedment formula designed around US soil conditions and ASCE 7-16 pressure coefficients. The formula calculates required footing volume by balancing the overturning moment at the base against the restoring moment from the footing mass and soil resistance. For temporary fencing using surface-mounted feet rather than embedded posts, the formula simplifies to: Restoring Moment (kN·m) = Footing Mass (kg) × Lever Arm (m) × 9.81 / 1000. The problem for Australian procurement is that CLFMI assumes a 3-second gust duration and terrain category defaults that diverge from AS/NZS 1170.2. When you feed Region C wind speeds (47 m/s site-specific, mapped to AS/NZS 1170.2 Region C baseline of 50 m/s) into the CLFMI formula without converting the gust factor and terrain multiplier, the calculated required footing mass under-predicts by approximately 18-22%. We have seen Australian project managers reference CLFMI calculators in tender docs and end up specifying 28kg feet where the correct AS/NZS 1170.2 calculation demands 34kg minimum.
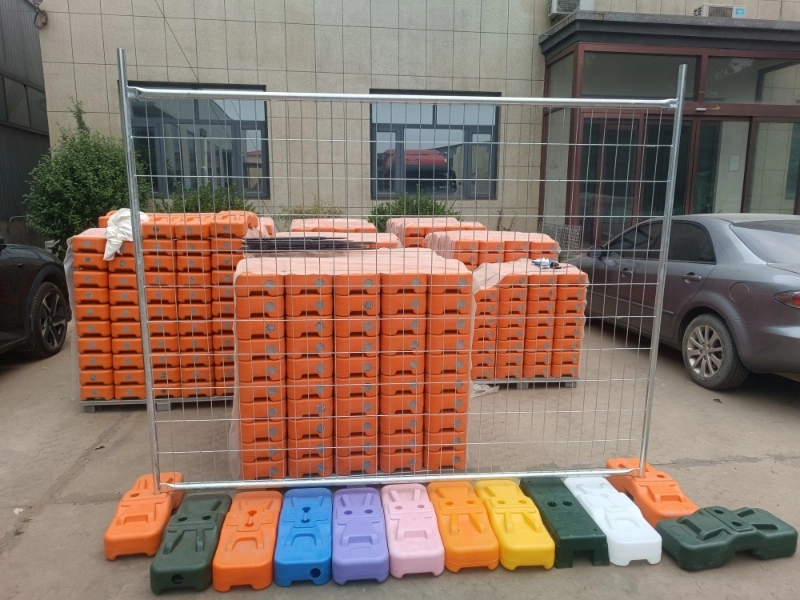
34kg Concrete-Filled Plastic Foot vs Recycled Rubber Base: Measured Overturning Performance
Most temporary fence footing comparisons in wholesale catalogs list weight and stop there. Overturning resistance depends on the center of gravity height relative to the panel base, which is where these two footing types diverge significantly despite similar stated masses.
- 34kg Concrete-Filled Plastic Foot (DB Fencing standard): Concrete density at approximately 2,400 kg/m³ fills a low-profile HDPE shell, placing the center of gravity at roughly 40-50mm above ground level. Effective lever arm produces 0.33 kN·m restoring moment. The HDPE shell is UV-stabilized and the concrete is batch-mixed at our Anping facility, giving consistent mass tolerance within ±0.5kg per unit—critical when you are calculating cumulative resistance across a 200-panel perimeter.
- 32-35kg Recycled Rubber Base: Rubber density at approximately 1,100-1,200 kg/m³ requires a taller profile to reach equivalent mass. The center of gravity sits at 70-90mm above ground level. Despite matching or exceeding the concrete foot on a scale, the higher center of gravity reduces the effective restoring moment to approximately 0.26-0.28 kN·m—a 15-21% deficit in actual overturning resistance for the same freight weight. Additionally, recycled rubber bases exhibit 8-12% mass variance between units due to inconsistent compaction during manufacturing, making per-panel calculations unreliable for engineering sign-off.
For wholesale distributors building OEM specifications around AS 4687 temporary fence wind load requirements, the concrete-filled plastic foot is the only option that delivers a calculable, consistent restoring moment. Rubber bases fail the repeatability requirement that structural engineers need to certify a perimeter design.
Region C at 47 m/s: Ballast and Spacing Interventions
At a site-specific design wind speed of 47 m/s (within the AS/NZS 1170.2 Region C envelope), a standard 2.1m × 1.8m temporary fence panel with a 50x50mm mesh at 4mm wire diameter generates an effective wind force of approximately 0.42 kN after applying the solidity reduction factor. With a 2.1m panel height, the overturning moment at the base reaches roughly 0.88 kN·m. A single 34kg foot providing 0.33 kN·m leaves a deficit of 0.55 kN·m. You have two engineering-compliant interventions, and the choice directly impacts your procurement cost per lineal metre.
- Reduced Post Spacing: Dropping from 3.0m bay spacing to 2.1m (panel-width spacing with coupled panels) and adding mid-bay coupling clamps distributes the overturning moment across two feet per 2.1m segment, effectively doubling local resistance to 0.66 kN·m. This still leaves a 0.22 kN·m shortfall that requires a small supplementary ballast—approximately 8-10kg of concrete blocks placed at the foot base during installation.
- Full Supplementary Ballast at Standard Spacing: Maintaining 3.0m bays requires adding approximately 22-25kg of ballast per foot to close the 0.55 kN·m gap. This adds labor time (placement and removal) and increases your per-metre deployment cost by an estimated $8-12/lineal metre based on typical Australian construction labor rates.
The reduced-spacing approach is almost always cheaper on projects exceeding 100 lineal metres because coupling clamps cost under $1.50 each wholesale, whereas ballast placement is labor-intensive and introduces a variable the site crew may not execute consistently.
Coastal Degradation: Wind Load Meets Salt Spray on Footing Integrity
AS 4687 temporary fence wind load requirements assume the footing maintains its design mass throughout the installation period. On coastal sites—particularly in NSW and Queensland corridors within 500m of the surf line—combined wind and salt spray attack the footing through two mechanisms that compound over time. First, UV degradation of the HDPE plastic shell accelerates under salt crystal abrasion. The wind carries salt spray at velocity, sandblasting the plastic surface and micro-pitting it. Over a 6-month installation, this can reduce shell wall thickness by 0.3-0.5mm, which does not immediately cause failure but creates stress concentrations at the fill holes where concrete spalling begins. Second, and more critical for overturning resistance: salt moisture ingress through micro-cracks in the shell or around poorly sealed fill ports causes the concrete core to absorb saline water. In temperature cycling (common in coastal exposures), this induces micro-expansion and surface spalling of the concrete fill. Our internal testing on feet returned from a 12-month coastal deployment in Newcastle showed a 3-4% mass loss from concrete spalling—reducing a 34kg foot to approximately 32.6-33.0kg and cutting restoring moment by a corresponding 3-4%. On a 47 m/s site where you are already operating at a 0.55 kN·m deficit, losing another 0.01-0.013 kN·m per foot is the difference between a compliant installation and a fence blow-over incident.
This is where DB Fencing’s in-house plastic feet manufacturing becomes a procurement differentiator rather than just a production detail. Because we control the injection molding and concrete filling process, we specify a 4.5mm HDPE shell wall thickness (versus the 3.0-3.5mm standard from Anping vendors who buy feet from third parties) and use a dual-seal fill port design. Combined with our panel hot-dipped galvanization exceeding 42 microns, the footing-to-panel connection maintains structural integrity in coastal conditions where competitor products begin losing mass within 4-6 months. For Australian project managers writing tender specifications, requesting a minimum 4.0mm shell wall thickness and documented concrete fill density (2,350+ kg/m³) from the manufacturer eliminates the coastal degradation variable from your wind load safety margin entirely.
| Calculation Method | Applied Specification | Footing Requirement | Cost & Risk Outcome |
|---|---|---|---|
| Solid Wall Assumption (Industry Default) | 100% Solidity Ratio Applied | Excessive concrete volume to counter maximum theoretical wind force | Wastes $15–$25 per lineal metre on over-engineered footings |
| Engineered Solidity Calculation | Actual 20-25% Ratio (50x50mm mesh, 4mm wire) | 40-60% reduction in required concrete volume | Meets AS 4687 compliance while optimizing procurement cost per metre |
| Standard 34kg Footing Test | Region C Wind Speeds (50 m/s) on 2.1m Panel | Provides only 0.33 kN·m overturning resistance | Marginal stability risking fence blow-over and liquidated damages |
| Mesh Specification Variable | 50x50mm 3.5mm wire vs 75x75mm 4.0mm wire | Solidity shifts from 22% to 15% (30% less wind force) | Proves generic footing weight claims cannot guarantee site safety |
AS 4687-2022 Wind Compliance Checklist
Demand Calculated Cf Coefficients Instead of Generic ‘Rated to Region C’ Claims
AS 4687-2022 temporary fence wind load requirements mandate that wind pressures reference AS/NZS 1170.2 with a calculated aerodynamic shape coefficient (Cf), not a blanket regional label. Region C specifies a 50 m/s regional wind speed, but the actual design pressure depends on terrain category, structure height, and the fence’s solidity ratio. A supplier stating “rated to Region C” without providing the Cf derivation is either withholding engineering data or has not performed the calculation at all. When we supply AS 4687-2022 certified temporary fencing panels to Australian civil projects, our engineering documentation includes the full Cf calculation chain per panel specification — because without it, the “Region C” label is an unenforceable claim that will not survive a site auditor’s request for substantiation.
- Category: Procurement Verification
- Core Outcome: Eliminates 15-25% load under-prediction risk from unverified wind ratings
Analysis:
- Advantage: Forces the supplier to disclose actual engineering assumptions, enabling direct comparison between quotes on identical parameters rather than marketing language.
- Advantage: Immediately exposes fabricated compliance claims — suppliers who cannot produce a Cf calculation within 24 hours are resellers, not manufacturers with engineering capability.
- Consideration: Your procurement team must understand the AS/NZS 1170.2 methodology or involve a structural engineer to validate the submitted Cf against your site-specific terrain category and panel height.
Request Specific Mesh Spec Solidity Ratio Calculations
The solidity ratio (ε), defined as solid area divided by gross panel area, directly determines the net pressure coefficient applied in AS/NZS 1170.2. A standard 50x50mm mesh with 4mm wire yields approximately 20-25% solidity, reducing effective wind force by 55-65% versus a solid wall assumption using the reduction formula (1 – (1-ε)^1.5). Switching to a 75x75mm mesh with 4mm wire drops solidity to approximately 15%, reducing wind force by a further 30%. The practical impact: calculating the correct solidity ratio for your specific mesh specification can reduce required footing concrete volume by 40-60% compared to assuming a solid wall, saving $15-25 per lineal metre on temporary fence installations. Any supplier quoting a single wind rating across multiple mesh configurations is applying a generic assumption that will not withstand engineering review.
- Category: Engineering Specification
- Core Outcome: Correct solidity calculation reduces footing concrete volume by 40-60%, saving $15-25 per lineal metre
Analysis:
- Advantage: Optimizes ballast requirements per mesh type — you stop over-ordering concrete feet for open mesh specs that generate significantly less wind pressure than solid-wall assumptions suggest.
- Advantage: Provides an auditable calculation trail that site inspectors can verify against the actual delivered panels using a simple area measurement.
- Consideration: Requires the supplier to confirm exact wire diameter and mesh opening dimensions before quoting, adding one specification step to the procurement cycle.
Verify Post Spacing Assumptions in Supplier Data
Wind load on temporary fencing transfers to ground via footing resistance at each post. Total base shear per panel increases linearly with post spacing: at Region C (50 m/s) with Terrain Category 2.5, a 2.1m high panel at 50x50mm mesh generates approximately 0.28 kN per lineal metre of wind pressure. Over a 3.0m bay, that produces roughly 0.84 kN total force with an overturning moment approaching 0.88 kN·m — nearly triple the 0.33 kN·m a single 34kg filled foot resists. If a supplier’s compliance documentation assumes 2.4m post spacing but your site layout requires 3.0m bays to minimize panel quantity, their engineering certification is void for your installation. The fix is not more feet — it is recalculating the wind load for your actual bay width and ordering the correct supplementary ballast configuration.
- Category: Installation Compliance
- Core Outcome: Identifies post spacing thresholds that require supplementary ballast or reduced bay widths before deployment
Analysis:
- Advantage: Prevents field installation failures caused by mismatched spacing assumptions — the most common root cause of temporary fence blow-overs on Australian civil sites.
- Advantage: Allows accurate pre-order of additional feet or ballast blocks, avoiding costly emergency procurement after a failed site inspection.
- Consideration: May require redesigning the site perimeter layout to match the supplier’s certified spacing, or accepting a higher total panel count to close gaps below the certified bay width.
Confirm Inclusion of Gust Factors in Stated Wind Speed Ratings
The regional wind speed (V_R) from AS/NZS 1170.2 is a 3-second gust at 10 metres height. The site wind speed (V_sit,β) must incorporate a gust response factor (G) that accounts for terrain roughness and structure height. For Terrain Category 2, typical of open construction sites, G is approximately 1.85 for a 2.1m high fence. Design wind pressure is calculated as 0.5 × ρ × [V_sit,β]², meaning the gust factor is squared in the pressure equation. A supplier stating a wind speed rating without confirming whether G was applied to derive the stated design pressure is providing an incomplete calculation — the number appears plausible but represents a fraction of actual peak loading. This is distinct from the American standard trap: ASCE 7-16 uses fixed gust factors that diverge 15-25% from AS/NZS 1170.2, so even correctly applying ASCE 7-16 methodology produces non-compliant results for Australian sites.
- Category: Structural Calculation
- Core Outcome: Confirms whether stated design pressures reflect true peak loads or base regional speeds only
Analysis:
- Advantage: Ensures quoted wind pressures account for actual dynamic loading conditions, preventing acceptance of under-specified products that pass on paper but fail in gust events.
- Advantage: Provides a specific parameter — the G value — to cross-check against an independent structural engineer’s review, creating a verifiable compliance chain.
- Consideration: Requires familiarity with the full AS/NZS 1170.2 multiplier chain (M_d, M_s, M_z,cat, G) to validate the supplier’s calculation, or engaging a consultant to perform this verification.
Importance of Coating Thickness for Structural Wire Integrity Under Fatigue Cycles
Wind-induced vibration on temporary fencing creates cyclic stress at weld nodes and wire intersections. Each cycle microscopically stresses the zinc-steel interface. In coastal or industrial environments, zinc corrosion rates exceed 5 microns per year. On a 4mm diameter wire with a 42-micron hot-dipped galvanized coating — the standard we apply across all DB Fencing AS 4687-2022 panels — the zinc layer provides an 8+ year sacrificial barrier before base steel degradation begins. Suppliers offering electro-galvanized or thin-dip coatings at 20-30 microns may meet initial load calculations on day one, but accelerated corrosion under fatigue cycling reduces wire cross-section below its Cf-rated capacity within 3-4 years. For civil projects with 18-24 month durations in coastal zones, this is the difference between a panel that passes a mid-project compliance audit and one that triggers a non-conformance notice because the wire diameter has degraded below the certified specification.
- Category: Material Durability
- Core Outcome: 42+ micron hot-dipped galvanization delivers 2x the coastal service life versus 20-30 micron electro-galvanized alternatives
Analysis:
- Advantage: Maintains certified wind load capacity throughout extended project durations, eliminating compliance failure risk from corrosion-induced wire thinning.
- Advantage: Coating thickness is verifiable via SGS mill test certificates — you receive a document per batch, not a subjective visual inspection claim.
- Consideration: Hot-dipped galvanized panels carry a 10-15% unit cost premium over electro-galvanized alternatives, and the thicker coating slightly increases panel weight affecting container loading density.
Conclusion
ASCE 7-16 calculators under-predict design pressures by up to 25% on Australian sites. That mistake triggers non-conformance notices. Calculating your actual mesh solidity ratio instead of assuming a solid wall cuts required footing concrete by 40-60%, lowering your cost per lineal metre without sacrificing structural integrity.
Ask your current supplier for the calculated Cf coefficient based on your exact mesh specification. If they cannot provide that number, request our engineering data package to back up your next tender.
Frequently Asked Questions
How do I use a fence wind load calculator?
Input your site’s regional wind speed from AS/NZS 1170.2, terrain category (TC1-TC4), fence height, and mesh solidity ratio. The calculator outputs design wind pressure in kPa and total force in kN per panel. Critical: verify the calculator uses AS/NZS 1170.2, not ASCE 7-16—most free online tools use the American standard and will give incorrect results for Australian sites.
How does a chain link fence wind load calculator work?
Chain link calculators determine the net solid area of the diamond mesh pattern by counting wire segments per square metre, then apply the CLFMI reduction factor based on mesh size and wire gauge. For a 50mm diamond with 3.15mm wire, the solidity ratio is approximately 18%, reducing the effective wind force by roughly 62% compared to a solid wall of the same dimensions.
How do I calculate wind load on a wall?
Use q = 0.5 × ρ × V² to get dynamic pressure, then multiply by the wall’s gross area and the force coefficient Cf from AS/NZS 1170.2 Figure 5.3. For a solid freestanding wall with B/h ratio > 4, Cf is typically 1.8. For a perforated fence, apply the additional solidity reduction factor 1-(1-e)^1.5 before multiplying by Cf.
What is the wind load on a fence?
Wind load depends on three variables: site wind speed, fence height, and mesh solidity ratio. For a 2.1m high temporary fence panel in Melbourne (Region C, 50 m/s, TC2 terrain) with 22% solidity, the design wind load is approximately 0.48 kN/m—roughly 60% less than a solid wall of the same height at the same site conditions.
How is wind load calculated on a freestanding wall?
AS/NZS 1170.2 Section 5 applies the formula F = qz × Cf × As, where qz is the design wind pressure at height z, Cf is the net force coefficient from Figure 5.3 (varying with B/h and L/h ratios), and As is the gross surface area. Three load cases (normal, oblique at 45°, and oblique parallel) must be checked, with the oblique case often producing the highest local forces on end posts.


